Defining the Thermal Boundary: Why “Dinner-Rush Failure” Occurs at 45°C
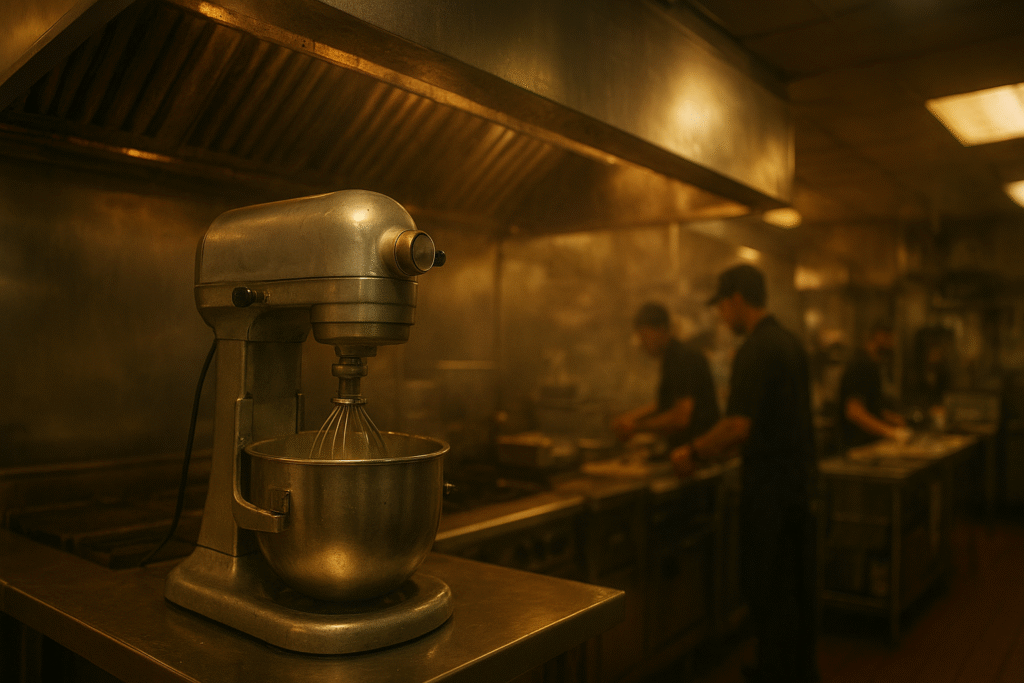
In lab qualification at 25°C, the appliance may run clean and stable. Then the dinner rush hits. In a 45°C back-of-house with sluggish airflow, the mixer motor’s housing becomes too hot to touch, a faint burnt odor appears, and thermal protection trips after roughly 90 minutes of continuous work. Staff then waits about half an hour for a restart.
To make this failure mode measurable (and comparable across suppliers), keep the boundary conditions explicit:
- Ambient near the motor: 45°C (not a 25°C bench).
- Convection level: low air velocity typical of enclosed appliance cavities.
- Fouling state: assume ~20% degradation in heat rejection from oil/particulate deposition unless you have field measurements.
The physics is straightforward: steady-state temperature rise (ΔT) scales with total losses and the effective thermal resistance to ambient. In commercial kitchens, oil films and particulates settle on housings and nearby baffles, elevating the air-side resistance and suppressing heat rejection. Treating oil/particulate fouling as elevated air-side thermal resistance is a common engineering approach, but the exact value depends on airflow, surface condition, and cleaning intervals and should be validated experimentally for your enclosure.
The temperature-rise gap between lab data and real kitchens
Lab data often reflects clean surfaces and ample convection around a test stand. Real kitchens are different. With 45°C ambient and elevated air-side thermal resistance due to oil/particulate fouling (used here as an illustrative engineering assumption), the same loss profile (copper + core + mechanical) results in a higher ΔT.
A first-order example shows why margin can collapse quickly:
| Parameter | Lab standard (clean) | Kitchen reality (45°C + fouled) | Why it matters |
|---|---|---|---|
| Ambient temperature | 25°C | 45°C | +20°C shifts every internal temperature upward |
| Effective thermal resistance, R_th (relative) | 1.0× | ~1.2× (illustrative; validate) | Higher R_th means the same losses produce higher ΔT |
| Steady-state temperature rise, ΔT (example) | ~90 K | ~108 K *(~90 K × 1.2)* | Reduced margin to insulation limits under continuous work |
| Estimated winding temperature (ambient + ΔT) | ~115°C | ~153°C | Approaches a Class F (155°C) ceiling if duty is effectively S1 |
One important caveat: the “ΔT scales with R_th” example assumes losses stay roughly constant. In reality, winding resistance rises with temperature, which can increase I²R loss and make the rise slightly non-linear. That’s why field-representative validation matters more than back-of-envelope scaling when you’re operating near the Class F margin.
Data note: unless otherwise stated, figures are based on a simulated 45°C ambient under fouled, low-convection conditions (i.e., elevated air-side thermal resistance due to oil/particulate fouling). Steady-state temperature rise is measured by the resistance method consistent with IEC 60034‑2‑1 practices, for which ABB provides a practical overview in its IEC 60034‑2‑1 method guide.
Most Common Root Cause: S2 Motors Forced Into S1 Reality
S1 continuous duty assumes the machine will reach and hold thermal equilibrium at load. S2 short-time duty, by contrast, assumes a fixed operating interval from ambient that ends before equilibrium, followed by full cool-down.
From a thermal design perspective, duty classification determines whether temperature rise is governed by steady-state equilibrium (S1) or by time-limited heat accumulation (S2). When an S2 motor is repurposed into near-continuous service in a kitchen, heat accumulates cycle over cycle. The temperature-rise curve that once flattened in the lab keeps climbing in the field.
This misapplication is magnified in high ambient kitchens: ΔT equals total losses multiplied by effective thermal resistance. Oil films increase R_th; low convection sustains the penalty; a 45°C baseline ambient shifts the entire curve upward. The outcome is predictable—thermal trips or accelerated insulation aging. That is why designing to Class F (155°C) with a target ΔT ≤ 105 K at 45°C ambient is the correct starting point for thermal resilience in this application space, as aligned with IEC temperature-rise classes summarized by Leroy‑Somer.
Cause hierarchy matters in root-cause reviews: duty-cycle mismatch (S2 used as near-S1) is typically the primary driver. High ambient temperature and grease/oil deposition are best treated as amplifiers that reduce heat rejection and shrink the safety margin.
Common Misconceptions About Thermal Management Risks
Misconception 1: “If the rated kW is high enough, it won’t overheat.”
Nameplate power doesn’t guarantee thermal survivability in a 45°C enclosure. The governing constraint is winding temperature under the actual duty. If the motor is effectively running S1 in the field, it must pass an S1-style steady-state temperature-rise verification under representative boundary conditions.
Misconception 2: “If it passed at 25°C in the lab, the thermal design is fine.”
A 25°C bench test typically assumes clean surfaces and higher convection than a grease-laden enclosure. In kitchens, higher ambient and elevated air-side thermal resistance from oil/particulate deposition can erase the margin, even if the electromagnetic design hasn’t changed.
Misconception 3: “Ambient temperature is fixed, so there’s nothing to do.”
Ambient may be fixed, but thermal resistance is not. Fouling and airflow path design can materially change heat rejection. Treat fouling as a boundary condition and validate it—don’t treat lab convection as a constant.
When the thermal “reservoir” overflows under continuous operation
In engineering terms, an S2-rated motor relies on thermal capacity to absorb heat for a limited time, followed by a long off period so stored heat can dissipate back to ambient. In dinner-rush reality, the off period often isn’t long enough. Heat accumulation can exceed the system’s steady-state dissipation capacity, so internal temperatures keep rising cycle over cycle. Quantitatively: if a mid-power motor shows ΔT ≈ 90 K at 25°C and clean surfaces, then under 45°C with elevated air-side thermal resistance due to oil/particulate fouling, steady-state ΔT can rise to roughly 108 K for similar losses. Absolute winding temperature approaches 45°C + 108 K ≈ 153°C. With Class F at 155°C, the margin is razor-thin; any transient spike or slight ventilation disruption tips the system into protection.
An effective fix is to reduce losses at the electromagnetic source: increase slot fill to cut I²R copper losses and employ low-loss silicon steel to reduce core losses. Reducing combined losses by even 10–15% will typically lower ΔT by roughly 6–12 K in this scenario, restoring safe headroom.
Simple Troubleshooting Path: A One-Shift Triage Table
The goal isn’t to “prove” IEC compliance in the field. It’s to quickly separate airflow/fouling limits from duty-cycle mismatch and load growth before you escalate.
| Step | Check Item | What You’ll See | Likely Cause | Next Action |
|---|---|---|---|---|
| 1 | Housing becomes “too hot to touch” within 30–60 minutes | Rapid exterior temperature rise; grease residue on screens/baffles | Air path restriction or fouling increasing effective R_th | Clean intake screens/filters/baffles; retest at the same load and note ambient and airflow |
| 2 | Trips only during long continuous runs (≈60–120 minutes), not short bursts | Predictable trip after extended run; restarts after cool-down | S2 motor effectively being used as S1 | Treat as duty-cycle mismatch; schedule a 45°C steady-state temperature-rise verification in the actual enclosure |
| 3 | Current trend after the first hour at steady mode (clamp meter) | Current rises over time at the same commanded mode | Mechanical load growth increasing losses (bearings, drivetrain drag, product viscosity) | Fix the mechanical cause first; then re-check steady current at 10 min vs 60 min |
| 4 | Current stays flat but trips | Electrical load stable; trip remains time/temperature-driven | Heat rejection limit (high ambient + low convection + fouling) | Improve enclosure airflow or reduce losses; validate against a Class F margin target (ΔT ≤ 105 K at 45°C) |
| 5 | Cool-down behavior | 20–30 minutes cool-down reliably resets; pattern repeats | Thermal protection responding to winding temperature | Confirm sensor placement and trip threshold; log ambient, runtime, and restart time for supplier review |
Any time you log temperatures or performance, keep boundary conditions explicit: 45°C ambient, low convection, and ~20% surface oil/particulate fouling simulation (or your measured equivalent).
How to Prevent Overheating: A Supplier Checklist for 45°C Kitchens
If you want an evidence-bound selection (instead of a lab-only pass), provide a short input pack up front:
- Load characteristics: required torque/speed, duty profile, and any overload events.
- Duty cycle: continuous runtime during peak rush and rest/cool-down windows.
- Ambient temperature: measured air temperature at the motor location during peak operation.
- Enclosure and heat-rejection path: airflow path, screens/filters/baffles, fan specs, clearances, and grease exposure.
- Validation target: confirm acceptance at 45°C ambient with ~20% surface oil/particulate fouling simulation, using the resistance method for steady-state ΔT.
This is the fastest way to align motor-level evidence with appliance-level temperature tests (for North American compliance programs, Intertek provides an overview of UL 763 motor-operated commercial food preparing machines).
Solutions and Improvement Directions: What Actually Buys Back Thermal Margin
In high-ambient commercial kitchens, the most robust lever is usually to cut internal heat generation (P-loss) rather than hope the enclosure airflow behaves like a lab stand.
A practical S1-ready target for this environment is:
- Insulation system: Class F (155°C).
- Acceptance target: steady-state ΔT ≤ 105 K at 45°C ambient (resistance method), preserving margin even with fouling.
- Boundary conditions note: data should be stated as “45°C ambient with ~20% surface oil/particulate fouling simulation; steady-state ΔT via resistance method.”
Standard Catalog Motor vs. Tuned Platform: what changes under S1 at 45°C
| Dimension | Standard Catalog Motor | Tuned Platform (application-tuned on a proven frame) | Why it matters in 45°C kitchens |
|---|---|---|---|
| Thermal margin at 45°C (+~20% fouling) | Often validated at 25–40°C with clean convection | Designed and verified against the actual boundary conditions | Margin, not nameplate power, determines whether you survive dinner rush |
| Duty-cycle fit | May be specified for S2-like short runs | Sized and validated as S1-ready for peak-hour continuous runtime | Prevents cycle-to-cycle heat accumulation |
| Validation speed & auditability | Generic reports; limited time/temperature traces | Auditable traces (ambient, load, stabilization) and documented enclosure airflow points | Compliance teams trust traceable data, not summaries |
| TCO drivers (downtime, service calls, returns) | Lower upfront cost, but higher risk of trips and accelerated aging | Higher upfront engineering effort, lower risk of field stoppages | One dinner-rush failure can outweigh small BOM savings |
| Upfront unit cost / BOM impact | Usually lowest unit price | May add cost (materials, copper, steel, test time) | Cost needs to be judged against downtime and warranty exposure |
Cutting electromagnetic losses at the source
Two electromagnetic changes are consistently high-impact for steady-state ΔT:
- Higher slot fill to reduce copper I²R loss at the required torque.
- Lower-loss silicon steel to reduce core loss.
In many mid-power appliance motors, a combined 10–15% loss reduction can translate to roughly 6–12 K lower steady-state ΔT in the same enclosure (first-order estimate), which can be the difference between a stable Class F margin and repeated thermal trips.
A minimal, auditable validation protocol you can request
Ask any vendor for a short protocol that makes the result comparable:
- Ambient and airflow verification: chamber fixed at 45°C; airflow documented to mirror the appliance cavity.
- Fouling simulation: oil/particulate deposit method targeting ~15–20% reduction in heat rejection; document area/mass/method.
- Instrumentation and method: winding resistance method consistent with IEC 60034-2-1 practices, supplemented by embedded detectors; stabilization defined as <1 K change over 30–60 minutes.
Report results with the boundary-condition note: Data based on 45°C ambient with ~20% surface oil-fouling simulation; steady-state ΔT via resistance method.
Conclusion: Thermal Margin Is the Lowest Total Cost of Ownership
A 45°C commercial kitchen is unforgiving: if an S2-rated motor is pressed into near-S1 service, temperature rise climbs, protection trips, and insulation life erodes. The most reliable path is to design and validate for the real boundary conditions—Class F margin with steady-state ΔT ≤ 105 K at 45°C, explicitly considering ~20% surface fouling in heat rejection.
Why margin translates into TCO
Reducing steady-state ΔT by 10–15 K doesn’t just “run cooler.” It directly shifts winding temperature away from the insulation ceiling. Using the common Arrhenius-style rule of thumb (insulation life roughly halves for each ~10 K rise and doubles for each ~10 K reduction), a 15 K reduction can roughly deliver a twofold life extension under similar duty. For background on insulation class limits and life implications, see the industry overview Motion Control Tips: what motor insulation class means.
If you want a 48-hour preliminary thermal estimate, send this input pack
- Peak-hour continuous runtime (minutes) and any rest periods
- Ambient temperature at the motor location (°C) during peak rush
- Enclosure and air-path notes (filters, baffles, grease exposure, fan specification, clearances)
- Load marker: measured steady current after 10 minutes and after 60 minutes in the same operating mode
Include this condition note in the request so the estimate is evidence-bound:Data based on 45°C ambient with ~20% surface oil-fouling simulation; steady-state ΔT via resistance method.