Aftermarket HVAC motor replacement gets messy because the load and the interfaces aren’t as deterministic as the nameplate suggests. Fan wheels, static pressure, and installation conditions shift the operating point. At the same time, OEM platforms fragment mounting footprints and shaft details. The outcome is predictable: SKU sprawl, mis-picks, and the second trip nobody budgeted for.
This article makes the engineering-to-finance chain explicit for Multi-Fit HVAC Replacement Motor ROI. A platform built around a wide-load operating window plus modular mounting interfaces can reduce the number of SKUs needed for coverage, improve DIO, and cut second truck rolls—using transparent assumptions and clearly stated test boundaries you can swap with your own baseline.
Count What Matters: TCO Components Every HVAC Distributor Must Model
Unit price is the easiest number to compare—and often the least predictive of the outcome you care about. For replacement motors, total cost of ownership (TCO) is a better engineering-aligned model: TCO = purchase price + inventory carrying cost (driven by DIO and mix) + compatibility risk cost (second truck rolls, counter returns) + downtime exposure. To keep the ROI discussion reproducible, it helps to separate inputs (what you can measure) from outputs (what you’re trying to improve). The numbers below are placeholders and ranges—replace them with your own baselines.
| Model lever (inputs) | Baseline | With Multi‑Fit platform | How to compute the impact |
|---|---|---|---|
| Active SKUs in the 1/6–1/3 HP band | 40–60 | 5–8 | Internal coverage simulation for residential NEMA 48/56 replacements |
| DIO for the category | 150–180 days | 45–60 days | Mix shift from low‑turn OEM‑specific SKUs to high‑turn universal SKUs (internal assumption) |
| Inventory carrying-cost rate | 20–30% | 20–30% | Use your finance rate; see the warehouse carrying-cost benchmark summary |
| Second truck roll rate | Use your baseline | Target model: lower | Avoided rolls/month = (baseline − new) × monthly jobs |
| Cost per second roll | $150–$250 | $150–$250 | Use $200 as an industry-estimate placeholder consistent with the ROI model |
| Install time saved per job | — | ~20 minutes | Labor hours saved/month = jobs × 20/60 (internal assumption) |
| Unit price uplift | Possible | Possible | Compare against annualized savings above; keep the boundary conditions explicit |
The key point isn’t “finance vs engineering.” It’s that uncertainty in load and fit becomes real dollars when the field has to improvise. When a platform is designed with wide-load thermal margin and repeatable mechanical interfaces, the system cost can move far more than a small unit-price delta. According to sector benchmarks, annual inventory carrying cost is often in the 20–30% range of average on-hand inventory value; use your own finance team’s rate if different, but don’t ignore it. See the industry summary on carrying-cost ranges in the warehouse statistics benchmark .
Break-even check: how much unit uplift is “too much”
You don’t need a perfect model to get a useful threshold. A simple break-even condition is: Allowable unit price uplift per motor ≤ (annual inventory carrying-cost savings + avoided second truck-roll savings) ÷ annual motor volume Using the placeholders in this article, you can compute the two biggest terms quickly:
- Inventory carrying-cost savings ≈ carrying rate × (baseline average inventory value − new average inventory value)
- Avoided truck-roll savings ≈ (baseline rate − new rate) × jobs/month × 12 × cost per roll
If that allowable uplift is higher than the price premium you’re being quoted, the ROI case is structurally sound—then the real work is validating coverage and staying inside the stated test envelope.
Three Hidden Financial Sinks Behind SKU Proliferation
In the replacement channel, SKU proliferation often looks like “coverage.” In practice, it shows up as cash tied up in slow movers, more opportunities for mis-picks, and more edge cases that trigger returns or repeat visits. Before talking about solutions, it helps to name the loss mechanisms clearly.
Dead Inventory and Working-Capital Drag
Here’s the day-to-day reality: a counter team needs to cover a wide spread of residential equipment with tight turnaround expectations. That pressure encourages distributors to stock narrow, OEM-specific variants “just in case.” The technical reason SKU counts balloon is simple fragmentation. Within common residential NEMA 48/56 families, small differences in shell diameter (5.0″ vs 5.6″), shaft length, and mounting approach (belly band vs studs) create parts that are close—but not interchangeable. That’s how you end up needing 50+ SKUs just to reach ~90% logical coverage (a coverage simulation, not a legal requirement). Under that pattern, DIO rises and working capital sits idle. Based on the ROI simulation model used in this analysis (adjust parameters according to your specific operational data), a Multi‑Fit platform can consolidate the legacy 40–60 SKU range down to 5–8 core universal models, with DIO improving from 150–180 days to 45–60 days as the mix shifts toward higher-turn universal positions. These assumptions are used solely to illustrate the Multi-Fit HVAC Replacement Motor ROI model.
Second Truck Rolls from Fit or Power Mismatch
Second trips usually trace back to two engineering realities: the motor didn’t bolt in, or it bolted in but didn’t run in the real load window. The first is footprint diversity (stud patterns, belly bands, brackets). The second is load uncertainty—fan wheels and static pressure shift torque and current away from a single rated point. For ROI modeling, we use a conservative industry estimate of $200 per second truck roll including fuel, ~1.5 hours of additional labor/opportunity cost, and overhead. A universal platform reduces the risk mechanically and electrically: Multi‑Mount interfaces cover common residential patterns (studs, resilient base, belly band slots), while wide-load winding design targets stable temperature rise across the 1/6–1/3 HP application band at the stated boundary conditions (details below). Together, these design choices are intended to support first‑visit‑fix performance above 95% in residential replacements under comparable site conditions.
Early Failures from ODP Misuse Outdoors
Another hidden sink comes from forcing indoor ODP (Open Drip Proof) motors into outdoor condensers. Moisture and dust ingress set you up for 12‑month winding failures and the inevitable RMA cycle. To protect your margins and prevent early replacements, outdoor NEMA 48/56 applications must be paired with sealed enclosures (TEFC/TEAO) and weather-resistant materials.
Turning Multi-HP and Multi-Mount Into ROI, Not Just Spec Sheet Lines
Engineering choices matter financially when they convert directly into fewer SKUs and fewer callbacks. Here’s how.
Wide-Load Electromagnetics as Insurance Against Sizing Error
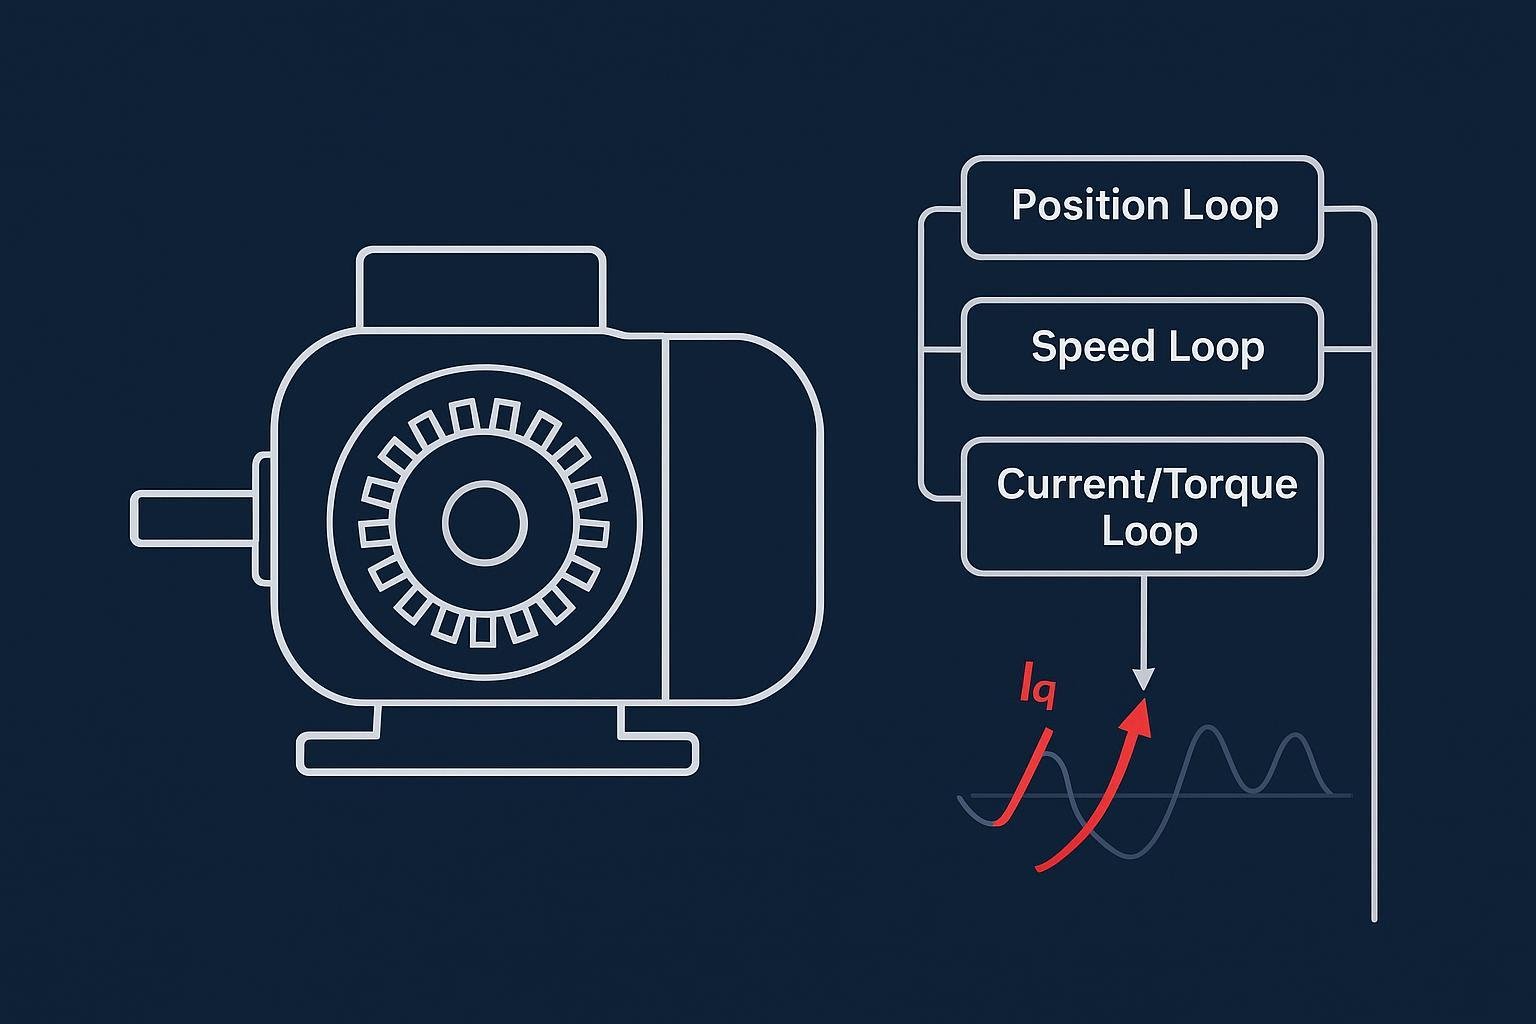
HVAC fan loads don’t behave like a lab brake. Changes in fan wheel geometry, static pressure, and airflow targets shift the operating point, which is why a replacement motor that is perfectly fine at one rated point can run hot (or behave oddly) when the real load lands elsewhere. Standardized Engineering Baseline Performance metrics are validated under a controlled test envelope—40°C ambient temperature, steady-state S1 duty cycle across the 1/6–1/3 HP range, with peak winding hotspots maintained below 130°C (within Class F 155°C insulation limits). From an engineering standpoint, the job is to keep current and temperature rise controlled across that window, not just at a single point.
- At lighter loads, auxiliary-winding current and phase balance can drift in a direction you don’t want. That can create unnecessary heating in the auxiliary circuit even when the shaft load is modest.
- At heavier loads, main-winding current and slip rise. Copper losses increase, and temperature rise climbs quickly if the design is optimized too tightly around a single rated point.
A wide-load design manages both ends of the window through thermal margin and main/aux circuit matching so neither side of the load range becomes the “hot corner.” The ROI translation comes afterward: when one platform stays inside the boundary conditions across 1/6–1/3 HP, it can credibly replace what would otherwise be three horsepower bins on the truck or shelf. In the model used here, that’s the mechanism that enables roughly 60–70% category breadth reduction—turning thermal margin into fewer SKUs, and fewer SKUs into Multi-Fit HVAC Replacement Motor ROI.
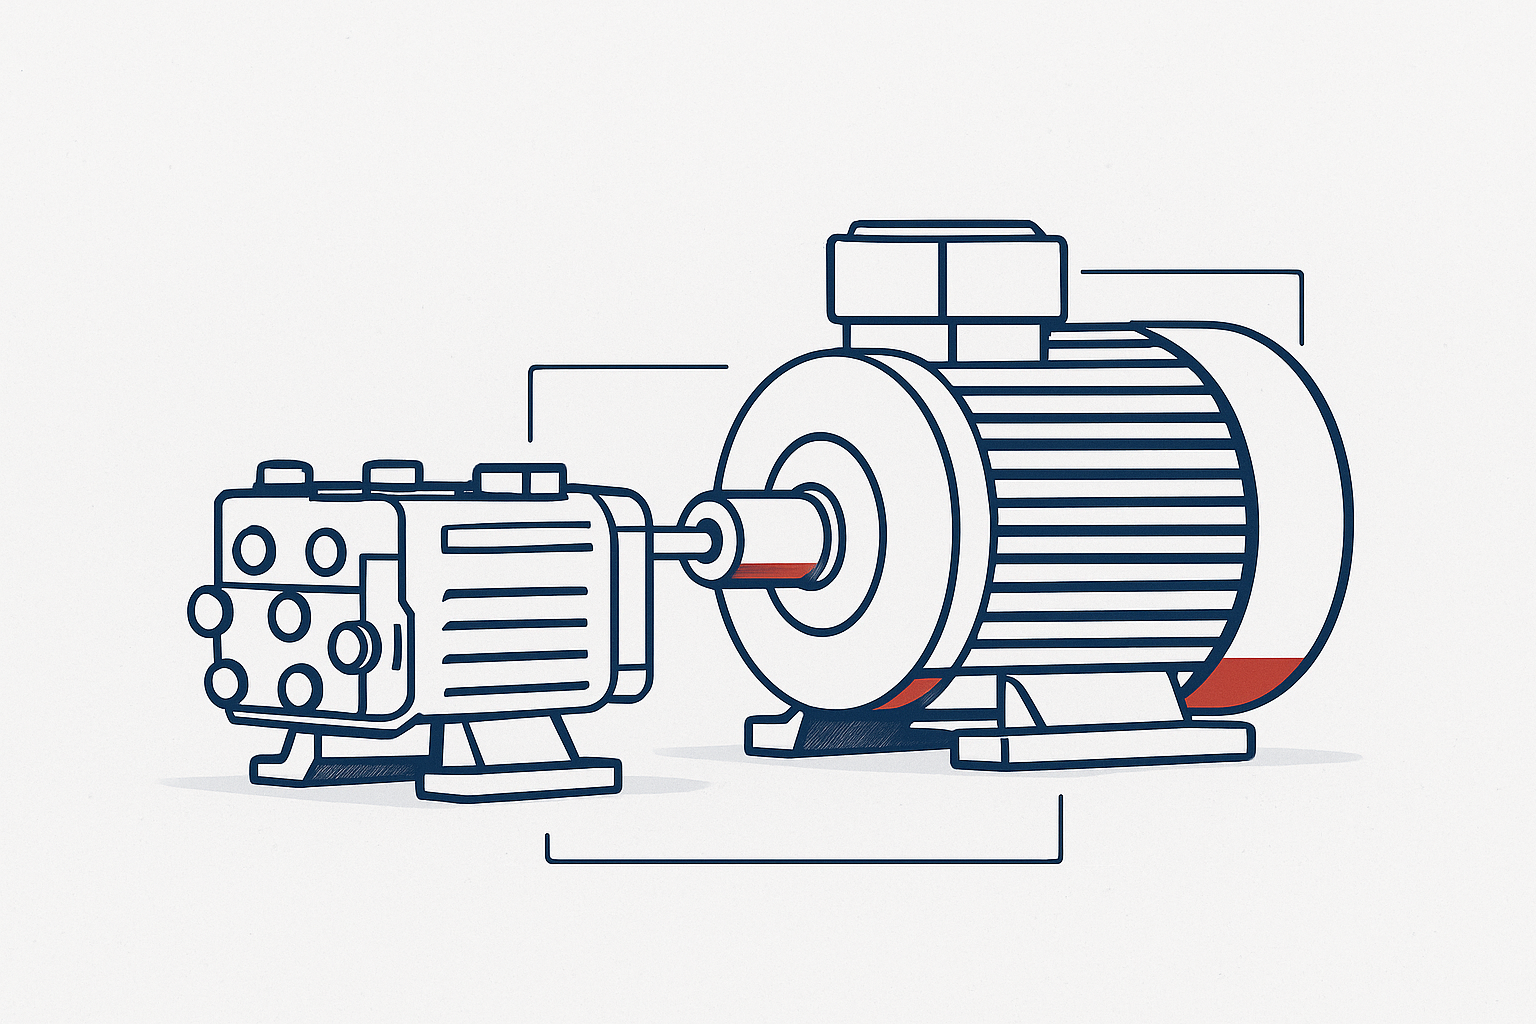
Modular Mechanics That Remove Field Fabrication Time
Multi‑Mount exists because OEM mounting is fragmented. In residential replacements you’ll see belly bands, stud mounts, and a variety of cradle/bracket geometries—often with just enough difference to turn a “universal” motor into a field-fabrication job. A Multi‑Mount platform addresses that at the interface level: extended studs, resilient base options, and belly‑band slots are designed into the product/accessory system so the installer is selecting a known interface rather than drilling, slotting, or improvising brackets. The rolled steel shell matters here as a mechanical base—stiffness helps maintain secure mounting and reduces handling-related distortion risk. For ROI modeling, we treat the time benefit as an internal assumption: avoiding on-site fabrication and rework saves about 20 minutes per installation in peak season conditions. On a busy service calendar, that time shows up as higher daily throughput and fewer schedule disruptions. 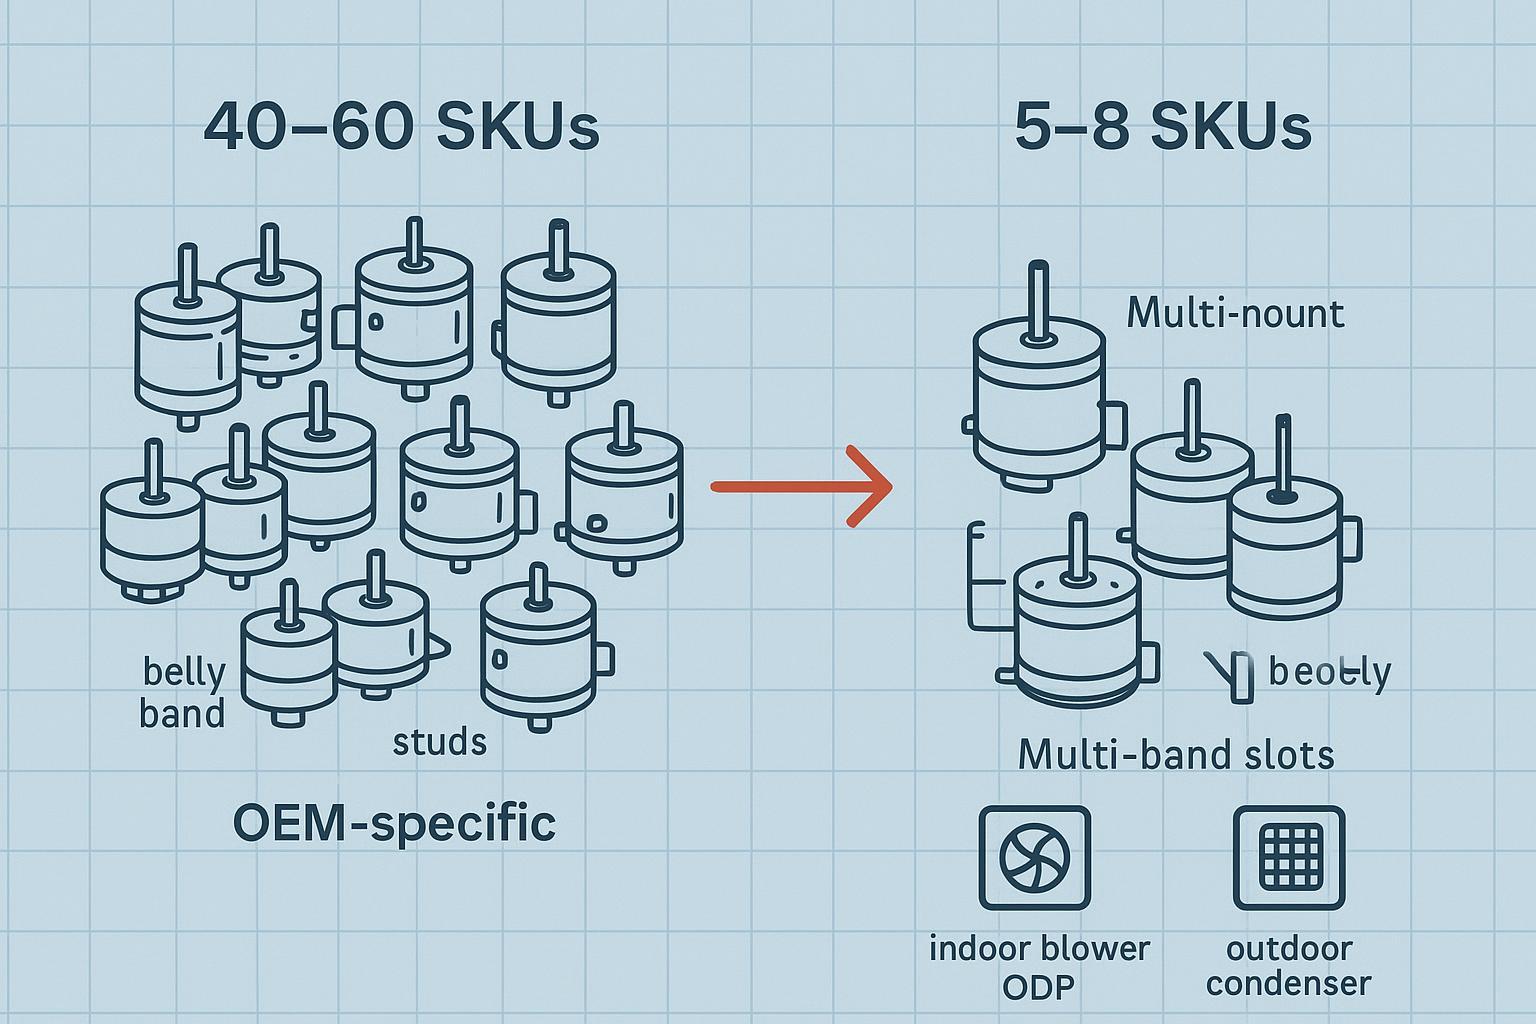 Below is a simplified ROI model to illustrate how these factors translate into measurable financial impact. Replace the inputs with your own values to build your local Multi‑Fit HVAC Replacement Motor ROI model.
| Model lever (inputs) | Baseline | With Multi‑Fit platform | How to compute the impact |
|---|---|---|---|
| Active SKUs in the 1/6–1/3 HP band | 40–60 | 5–8 | Internal coverage simulation for residential NEMA 48/56 replacements |
| DIO for the category | 150–180 days | 45–60 days | Mix shift from low‑turn OEM‑specific SKUs to high‑turn universal SKUs (internal assumption) |
| Inventory carrying-cost rate | 20–30% | 20–30% | Use your finance rate; see the warehouse carrying-cost benchmark summary |
| Second truck roll rate | Use your baseline | Target model: lower | Avoided rolls/month = (baseline − new) × monthly jobs |
| Cost per second roll | $150–$250 | $150–$250 | Use $200 as an industry-estimate placeholder consistent with the ROI model |
| Install time saved per job | — | ~20 minutes | Labor hours saved/month = jobs × 20/60 (internal assumption) |
| Unit price uplift | Possible | Possible | Compare against annualized savings above; keep the boundary conditions explicit |
Note: All ‘Benchmark’ values reflect modeled assumptions based on typical aftermarket service scenarios(40°C ambient, S1 duty, 1/6–1/3 HP, hotspot ≤130°C within Class F). We encourage partners to input their specific localized data into this TCO framework for a tailored analysis.
Offsetting the BOM Premium: Resilience and Cash Flow Optimization
A reasonable concern is whether a high-spec, multi-interface platform carries a modest BOM premium. The ROI question isn’t whether that premium exists—it’s whether it’s smaller than the systemic waste it helps avoid. There are two primary offsets:
- Inventory Velocity: When the SKU set collapses into high-turn universals, DIO (Days Inventory Outstanding) typically improves. Releasing capital from “long-tail” dead stock is often more impactful to the bottom line than a minor unit-price delta.
- Application-Specific Reliability (The Outdoor Context): In HVAC, the most frequent failure point in the replacement cycle is the outdoor condenser fan. Treating enclosure choice as a footnote is a mistake; a TEFC (Totally Enclosed Fan Cooled) rolled-steel construction is a strategic investment. It mitigates moisture ingress and handling-related air-gap distortion—risks that, if ignored, lead to premature RMA cycles that destroy ROI.
To de-risk a platform transition, focus on Risk-Free Prototyping and Seasonal Stocking Windows rather than chasing short-term price concessions. These workflows allow engineering teams to validate wide-load thermal behavior before broad deployment. For those benchmarking these principle-level programs, Honest Motor provides the baseline engineering data and cross-regional supply resilience needed to support such a transition.
Decision Lens: Stop Buying Motors—Start Buying Inventory Turnover
The business case is only as strong as its underlying engineering. By designing for wide-load thermal margin and standardized mounting interfaces, we proactively eliminate the two most common field failures: motors that ‘fit but overheat’ and those that ‘run but won’t mount.’ Solving these technical uncertainties at the source allows for a radical consolidation of SKU depth, which in turn drives the financial outcomes every distributor seeks: lower DIO and a significant reduction in second truck rolls. If you’re modeling Multi-Fit HVAC Replacement Motor ROI for your own operation, keep the inputs grounded:
- Define the load window you actually see in the field, then only credit wide-load coverage within that window.
- Treat Multi‑Mount as an interface standardization problem first; time savings is a downstream effect.
- Separate indoor blower ODP needs from outdoor condenser TEFC requirements so reliability doesn’t get traded for short-term availability.
Technical Baseline:All performance claims and ROI projections in this article are derived from a controlled engineering envelope: 40°C ambient, steady-state S1 duty cycle, and a maximum winding hotspot of 130°C (Class F insulation). When evaluating alternative platforms or field data, stakeholders should document ambient and duty-cycle deviations to ensure a valid comparison. For a low-risk transition, run a 4–6 week consolidation pilot on residential NEMA 48/56 replacements, then expand positions only after form/fit/function checks are complete. If you want a one-page TCO check, collect these inputs (copy/paste into an email or spreadsheet):
- Monthly replacement jobs in the 1/6–1/3 HP band
- Current active SKU count for that band
- Current DIO for the category
- Inventory carrying-cost rate used by finance
- Current second truck-roll rate attributable to fit/power mismatch
- Fully loaded cost per second truck roll
- Share of jobs that are outdoor condenser applications (TEFC required)
- Acceptable unit price uplift range you’re willing to consider
Structured workflows such as Seasonal Stocking Windows and Risk‑Free Prototyping can reduce qualification friction without relying on short-term price concessions.